Dynamics of locomotor fatigue during supra-critical power exercise in humans
Abstract
We aimed to measure 1) the dynamics of locomotor fatigue at the onset of high-intensity cycling, and 2) the reserve in locomotor power following constant and ramp-incremental cycling to the limit of tolerance. Fifteen participants completed ramp-incremental or constant power exercise tests to the limit of tolerance. Immediately following intolerance, participants completed a short (<5 s) maximal isokinetic effort at 70 rpm. The time course of locomotor fatigue during constant power high-intensity exercise was characterized using short maximal isokinetic sprints at 30 s, 60 s, 120 s, 180 s during constant power exercise. Constant power exercise duration was 312 ± 37 s. Isokinetic power production at 30, 60, 120, 180 s and the limit of tolerance was 609 ± 165, 503 ± 195, 443 ± 157, 449 ± 133, and 337 ± 94 W, respectively. Isokinetic power output decreased by ~50% within the first minute of exercise and significant (p<0.05) reductions in isokinetic power occurred at all time-points vs the baseline maximal isokinetic power (666 ± 158 W).. Additionally, a significant power reserve of 132 ± 74 and 119 ± 80 W was present at the limit of tolerance to constant power and ramp-incremental exercise. Therefore, instantaneous isokinetic power production at the limit of tolerance exceeded that of the task requirement, providing a temporary dissociation of the perceptual and physiologic limits. Locomotor fatigue occurred rapidly during supra-critical power exercise. The dynamics of fatigue were similar to the primary fatigue-related intramuscular metabolites, suggesting a close mechanistic link between the intramuscular milieu and voluntary muscle power.
Introduction
Exercise intolerance is a powerful predictor of mortality and negatively impacts quality of life and activities of daily living (Myers et al. 2002; Paffenbarger et al. 1993; Newman et al. 2006). Improving exercise tolerance has consistent positive impacts on healthy and diseased populations (Belardinelli et al. 1999; Bendstrup et al. 1997; Warburton et al. 2006). Therefore, understanding the mechanisms of fatigue and exercise intolerance is crucial for identifying effective prevention and rehabilitation for chronic conditions that negatively impact physical function. Fatigue is a loss in the capacity for developing force and/or velocity of a muscle, resulting from muscle activity under load and which is reversible by rest (Gandevia, 2001). Both central and peripheral components contribute to the fatigue process, and therefore nearly every step in the cascade from brain to muscle cross-bridge has the potential to impact exercise tolerance. Central activation fatigue is defined as a reduction in the capacity of the central nervous system (CNS) to recruit motor units, while peripheral fatigue is the reduction in power production at a given level of skeletal muscle activation. These mechanisms conflate to produce locomotor fatigue that is readily measurable with ergometry, but the central and peripheral components are not easily distinguishable from one another. Some of the mechanisms contributing to fatigue during dynamic, whole-body exercise include heightened perception of exertion or dyspnea, inhibitory afferent signals from the skeletal muscle environment, reduced membrane excitability, and local muscle metabolic and ionic factors that directly inhibit cross-bridge function (Marcora et al. 2010; Laurin et al. 2015; Cady et al. 1989; Froyd et al. 2016; Westerblad et al. 2002; Gandevia, 2001; Cooke et al. 1988). The roles and relative importance of these mechanisms, however, remain largely uncertain and are even unlikely to be comprehensive. The dynamics, or rate of accumulation, of locomotor fatigue may provide information about how the intracellular milieu underpins intolerance, as the dynamic behavior of key fatigue-related metabolites is well-established in the literature.
Fatigue progresses from the onset of exercise at a rate depending on exercise intensity and duration (Gandevia, 2001; Enoka & Stuart, 1992). In addition to the direct influences of metabolites on the cross-bridge (Fitts 2008; Kent-Braun et al. 2012), it is also likely that during high-intensity exercise, skeletal muscle afferent inhibitory signals feed back to the motor cortex (Gandevia 2001). These signals are primarily transmitted via group III and IV afferents (Laurin et al. 2015; Enoka & Stuart, 1992). These metabosensitive receptors, or ‘metaboreceptors’, regulate central motor drive by acting on both the spinal motor reflex and descending motor pathways to adjust motor commands during fatiguing physical activity (Laurin et al. 2015; Enoka & Stuart, 1992). Afferents may either facilitate or inhibit motor unit recruitment, improving or impairing exercise tolerance, and therefore our understanding of their role in exercise tolerance is only in its infancy (Gandevia, 2001; Laurin et al. 2015; Hureau et al. 2014; Enoka & Stuart, 1992). Nevertheless, the metabolic byproducts that accumulate from the onset of exercise are very likely to play an important role in fatigue through a complex interplay of local and central nervous system events.
Fatigue-related metabolites are generated as byproducts of the energy pathways. The hydrolysis of ATP releases free energy needed to fuel muscular contraction, and produces inorganic phosphate (Pi) and adenosine diphosphate (ADP). Pi and ADP decrease power, maximum contraction velocity, and ATPase activity in an additive manner (Cooke et al. 1988). Pi elicits substantial effect in reducing force when concentration rises to 10 mM, and may reach above 20 mM during high-intensity exercise (Westerblad et al. 2002; Cooke et al. 1988). The time-course of Pi conforms to a pseudo-exponential profile with a half-time somewhere in the region of 30 s, meaning that for constant power exercise, most of the change occurs within the first 2-3 minutes of contraction (Cady et al. 1989; Jones et al. 2008; Millar et al. 1990). Interestingly, during high-intensity exercise, reduction in locomotor muscle power seems to behave with similar dynamics, but the time-resolution available in the literature for muscle power measurements is relatively poor (Cannon et al. 2011; Myers et al. 2002; Froyd et al. 2016; Froyd et al. 2013; Gandevia, 2001). No research has investigated the initial, rapid dynamics of locomotor fatigue during whole-body, dynamic exercise. Therefore, the time-course of fatigue during the first ~3 min of high-intensity exercise is unknown.
Ideally, laboratory measurement of locomotor fatigue is applicable to whole-body, large muscle mass, dynamic exercise (walking, running, cycling). Additionally, it is absolutely critical that contraction velocity be controlled for, if the entirety of the power-velocity relationship is not measured (Ferguson et al. 2016a, 2016b) – locomotor power is dependent on the parabolic power-velocity relationship. Assessing fatigue using a combination of cadence-dependent cycling tasks followed immediately by a maximal isokinetic effort allows the velocity-specific decline in power to be measured. The recovery of skeletal muscle power during high-intensity exercise is rapid, with most of the recovery occurring within the first two minutes following exercise and nearly full recovery at eight minutes (Coelho et al. 2015; Froyd et al. 2013). These data show the importance of rapidly measuring locomotor fatigue, and highlight one of the key drawbacks of using electrical stimulation, transcranial magnetic stimulation, or single-joint maximal voluntary contraction that requires, at minimum, a 1-2 min delay from the time of interest (Amann et al. 2008; Froyd et al. 2013).
Exercise intolerance is thought to be defined when the reduction in maximal evocable locomotor power is sufficient enough to constrain the exercise task. This is a contentious issue, however, with some evidence to show there is a large ‘reserve’ in locomotor power (Amann et al. 2008; Marcora et al. 2010; Froyd et al. 2016), while others fail to find this reserve at the limit of tolerance (Ferguson et al. 2015). Whether or not the limit of tolerance is consistently accompanied by a ‘reserve’ in locomotor power remains uncertain.
Thus, the purposes of this study are twofold. Firstly, we aimed to measure the dynamics of locomotor fatigue at the onset of high-intensity cycling. Second, we aimed to measure the reserve in locomotor power following constant and ramp-incremental cycling to the limit of tolerance.
Materials and Methods
Ethical Approval and Participants
Fifteen healthy, recreationally-active volunteers (7 females, 8 males) took part in this study (Table 1). Volunteers provided written informed consent and were screened for cardiovascular risks with the Physical Activity Readiness Questionnaire (PAR-Q) prior to beginning the study. Additionally, participants were informed of the possibility of risks associated with high-intensity exercise and were told they were allowed to withdraw from the study at any time for any reason. The San Diego State University Institutional Review Board approved this study, and all procedures complied with the latest revision of the Declaration of Helsinki and Belmont Report.
Exercise Protocols
Participants completed 6 laboratory visits, each separated by a minimum of 24 hours. Within each laboratory visit the participants completed two experimental phases: 1) short (<5 s) bouts of maximal effort isokinetic cycling at 70 rpm to determine maximal isokinetic power generation at baseline; and 2) a ramp-incremental or constant power exercise test, followed by a short (<5 s) maximal isokinetic effort at 70 rpm performed immediately at the limit of tolerance.
The first laboratory visit included a ramp-incremental test to the limit of tolerance. The initial test began with 1 min rest and a 2 min warm-up phase at 25 W. Following the warm-up, power was increased at 25 W/min until intolerance. Each participant was instructed to maintain a cadence > 70 rpm. Failure to maintain > 70 rpm, despite strong verbal encouragement, marked the termination of the ramp-incremental phase. Immediately following intolerance, the cycle ergometer was switched from hyperbolic to isokinetic mode and the participant was instructed to give a maximum effort for 3-5 seconds. Participants then completed a 5 min recovery phase at 20 W.
During the second visit, participants completed a constant power exercise test to the limit of tolerance. To assign each participant’s constant power, 50 W was subtracted from peak power measured during ramp-incremental exercise. Participants began with 1 min seated rest followed by a 2 min warm-up at 25 W. This was a modified approach (van der Vaart et al. 2014) to estimate an ~6 min duration exercise test, based on our pilot testing. Following completion of warm-up, power was increased abruptly to the assigned constant power and participants were instructed to maintain the power until the limit of tolerance. Failure to maintain > 70 rpm marked the end of the constant power phase, and the cycle ergometer was switched from hyperbolic to isokinetic mode where participants were strongly encouraged for 3-5 seconds of maximal effort cycling. Participants then completed a 5 min active recovery phase of light cycling at 20 W.
The remaining 4 visits were completed in random order and consisted of constant power cycling at the same work rate during visit 2. However, the durations of the final 4 visits were 30, 60, 120, and 180 s. These tests were completed with essentially the same format, yet halted at the pre-determined times rather than continued to the limit of tolerance. Within the final ~5 s of the exercise bout, participants were instructed to decelerate to ~ 70 rpm to avoid an overcompensation of the flywheel braking action at the onset of the isokinetic cycling. At the completion of the pre-determined constant power cycling, the cycle ergometer was switched from hyperbolic to isokinetic mode where participants gave a maximal effort for 3-5 seconds. A 5 min active recovery phase at 20 W followed, marking the end of the test.
Measurements
Ergometry
All exercise tests were conducted on a computer-controlled electromagnetically braked cycle ergometer (Excalibur Sport PFM, Lode BV, Gronigen, NL). Left and right torque (Nm) was measured independently (peak force 2000 N, < 0.5 N resolution and measurement uncertainty of < 3%). Angular velocity of the crank (Rad.s-1) was measured every 2 degrees and multiplied by torque to calculate power. Isokinetic power reported in our paper was measured from both left and right cranks and averaged over three crank revolutions.
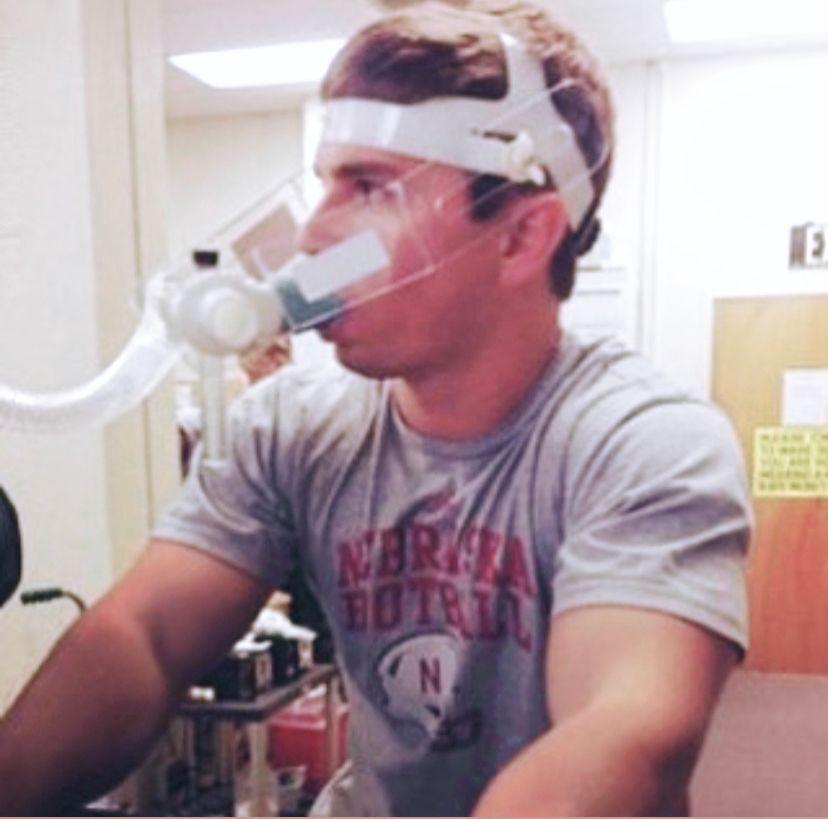
Pulmonary Gas Exchange
Respired gases and ventilation were measured breath-by-breath with a commercial metabolic measurement system (VMax Encore, CareFusion, San Diego, CA USA). The system was calibrated immediately prior to each testing session. A 3 L syringe (Hans Rudolph Inc., Shawnee, KS, USA) was used to calibrate the mass flow sensor from ~0.2 to 8 L.s-1, mimicking flow rates expected at rest and during exercise. The CO2 and O2 analyzers were calibrated using gases of known concentrations (O2 26.0% and 16.0%; CO2 0.0% and 4.0%).
Statistical Analysis
A paired sample t-test was used to assess task power vs. isokinetic power at exercise intolerance. A one-factor (time) repeated measures analysis of variance was performed to analyze the reduction in isokinetic power over time. Post hoc t-tests were used to determine the location of differences in the event of a significant omnibus test. Statistical tests were considered significant at the p<0.05 level. All data was analyzed using the Statistical Package for the Social Sciences (SPSS v22. SPSS Inch., Chicago, IL, USA). Results are reported as mean ± SD.
Results
Oxygen uptake during ramp-incremental and constant power exercise
VO2peak during ramp-incremental and constant power exercise was 3.3 ± 0.7 L/min and 3.4 ± 0.7 L/min, respectively. VO2peak was not different between ramp-incremental and constant power exercise. Figure 2 shows individual ramp-incremental and constant power VO2peak values.
Isokinetic power and power reserve following ramp-incremental exercise
At baseline, participants generated a maximum isokinetic (70 rpm) power (BLPiso) of 666 ± 158 W. During ramp-incremental exercise, participants achieved a peak power of 254 ± 47 W. At intolerance, participants generated a maximal isokinetic (70 rpm) power of 373 ± 101 W, and this was greater than peak ramp power (p<0.05; Figure 3). Therefore, participants exhibited a reserve for instantaneous power of 119 ± 80 W (or 47 ± 31% of ramp peak power) (Figure 4). Additionally, there was no difference (p>0.05) in the magnitude of the power reserve at intolerance between ramp-incremental and constant power exercise (Figure 5).
Isokinetic power and power reserve following constant power exercise
Constant power (205 ± 46 W) exercise duration was 312 ± 37 s. At intolerance, participants generated an isokinetic power of 337 ± 94 W, and this was greater than the required constant power (p<0.05). This resulted in a power reserve of 132 ± 74 W or (64 ± 35% of the constant power) (Figure 6 and 7).
Time course of locomotor fatigue during constant power exercise to intolerance
Maximal isokinetic power output declined throughout heavy constant power exercise (Figure 8). As presented in Figure 9, maximal isokinetic power declines rapidly. By 60 s, participants generated 76 ± 29% of baseline maximal isokinetic power. By the limit of tolerance, participants generated 51 ± 14% of the baseline maximal isokinetic power. Therefore, 49% of total locomotor fatigue occurred within the first 60 s of high-intensity exercise.
Discussion
We investigated the kinetics of fatigue at the onset of high-intensity, whole-body exercise. The major findings of this study include: 1) locomotor fatigue occurs pseudo-exponentially and rapidly, with 49% of total fatigue accumulating within the first minute of exercise, and 2) a 47 ± 31% and 64 ± 35% locomotor power reserve is present at the limit of tolerance in ramp-incremental and constant power exercise, respectively. Therefore, locomotor fatigue accumulates rapidly during high-intensity exercise, following an approximately exponential profile. However, at the limit of tolerance, participants exhibited a reserve for instantaneous power production that exceeds the task requirement.
Locomotor fatigue within the first minutes of high-intensity exercise
At the onset of high-intensity exercise, the finite kinetics of oxidative phosphorylation necessitates that glycolysis and phosphocreatine breakdown make substantial contributions to maintain ATP concentration (~8.2 mM) (Kemp et al. 2007). This two-part anaerobic energy system begins with the phosphagen system due to the ability to generate ATP very rapidly. During this single-step reaction, phosphocreatine (PCr) donates a high energy phosphate to resynthesize ATP. During the initial ~10 s of high-intensity exercise, PCr stores rapidly fall while inorgantic phosphate (Pi) levels rise. Pi concentration is tightly correlated to force production, such that high Pi decreases ATPase activity and power production (Cooke et al. 1988). During the first 30 s of exercise in our experiment, significant fatigue has already accumulated (Figure 8).
In addition to depletion of the finite PCr stores, glycolysis contributes to ATP resynthesis and is activated within seconds of exercise onset (Walsh et al. 2008). In addition to ATP production, lactate is produced. While lactate is almost certainly the preferred fuel of mitochondrial oxidative phosphorylation, the associated acidosis may be detrimental to muscle function. This occurs due to an acidic muscular environment reducing the number of high-force cross bridges in fast fibers and the force per cross bridge in both fast and slow fibers as well as reducing myofibrillar Ca2+ sensitivity (Fitts 2008).
Continual depletion of the finite energy (PCr, glycogen) sources leads to heightened levels of Pi, ADP, and lactate levels in working skeletal muscles. End-product inhibition of hydrolysis byproducts is proposed to affect actomyosin cross-bridges at different levels of the kinetic chain, ultimately reducing the free energy production of ATP hydrolysis (Cady et al. 1989). Additional research supports this claim, showing the additive effects of Pi and H+ decreasing power through cross-bridge kinetics disruption when elevated above resting levels (Cooke et al. 1988). Our findings show that locomotor fatigue accumulates with a similar time course to that of intramuscular metabolites. We feel this lends support to the hypothesis that a large majority of fatigue is therefore due to the accumulation of intramuscular metabolic byproducts.
Total locomotor fatigue accumulation at limit of tolerance
Constant power exercise was maintained for 312 ± 37 s prior to intolerance. Progressive reduction in isokinetic power output is seen up until this point (Figures 8 and 9). Critical power (CP) represents the highest work rate that will elicit a metabolic steady-state, and therefore demarcates sustainable from non-sustainable exercise.
While fatigue related metabolites reach a plateau at ~ 2-3 min during sub-CP exercise, continual accumulation up to intolerance is seen in supra-CP exercise (Jones et al. 2008). Similarly, participants performing sub-CP exercise were able to maintain velocity-specific peak power between 3 and 8 min of exercise (Cannon et al. 2011). Together, this lends support to the close-linkage between the intramuscular environment, locomotor fatigue, and exercise tolerance. Our data show a continual accumulation of locomotor fatigue during supra-CP exercise, and fit closely with this assertion that the intramuscular events underpin the reduction in voluntary muscle power.
In addition to peripheral contributors to fatigue, afferent feedback and efferent feedforward mechanisms (including conscious perception of effort) may modulate exercise tolerance. Maximal voluntary contraction (MVC) force production falls progressively while evoked peak power reaches a plateau (~ 40% of time trial) during non-sustainable exercise (Froyd et al. 2013; Hureau et al. 2014). Additionally, early accumulation of peripheral fatigue is compensated for by increased motor drive, and task failure therefore may be due, ultimately, to increased central fatigue arising late in the exercise task (Decorte et al. 2012). Therefore, in addition to intramuscular fatigue-related metabolite buildup, central regulation, as well as intrinsic modulations effected by emotional responses to exercise, likely play a role in the development of fatigue (Decorte et al. 2012; Froyd et al. 2016; Sidhu et al. 2013). As we did not measure contributions of ‘central’ and ‘peripheral’ mechanisms of fatigue, we can only provide speculation as to the origin of locomotor fatigue in our data. Therefore, the close dynamic association of our locomotor power data to build up of intramuscular metabolites may only be coincidental, and not causal.
A reserve in locomotor power generating capacity at the point of intolerance
Brief maximum isokinetic power at the limit of tolerance was higher than the task power in both ramp-incremental and constant power exercise (Figures 4 and 7). This represents a temporary separation between perceptual and physiological limits of power production. It is important to note that there was no difference in VO2peak in ramp and constant power exercise, showing individuals did attain systems limits in both exercise test formats. Additionally, the reserve in locomotor power represents a near-instantaneous (~3-5 second) capacity for power production. To what extent this power reserve can be maintained is still unknown.
Additional recruitment of motor units is almost certainly responsible for the instantaneous increase in force production (Froyd et al. 2016), suggesting that the limit of tolerance during the exercise task is not defined by a ceiling of motor recruitment. Exercise tolerance may therefore be limited by perception of effort, rather than neuromuscular fatigue that ‘caps’ power production sufficient to continue the task (Marcora et al. 2010). However, these perceptual effects may be dependent on the population studied (chronic cardiopulmonary disease vs healthy vs athlete). Contrary to our findings, no reserve was found following whole body exercise in men with VO2max 4.2 ± 1.0 L/min (Ferguson et al. 2015). It is possible that highly-trained individuals exhibit central and peripheral fatigue mechanisms different to that of our recreationally-active participants. No research has examined oxidative capacity as a modifier of the locomotor power reserve, or the mechanisms which underpin this phenomenon.
Conclusions
We aimed to measure 1) the dynamics of locomotor fatigue at the onset of high-intensity cycling, and 2) the reserve in locomotor power following constant and ramp-incremental cycling to the limit of tolerance. Maximal voluntary isokinetic power fell progressively during constant power exercise. However, ~50% of the total fatigue occurred in the first 60 s of exercise, showing rapid, approximately exponential kinetics. In addition to fatigue dynamics, we showed that a temporary power reserve was present at the limit of tolerance to both ramp-incremental and constant supra-critical power exercise. Therefore, short-term maximal isokinetic power production at the limit of tolerance exceeded that of the task requirement, providing a temporary dissociation of the perceptual and physiological limits. Locomotor fatigue occurred rapidly during supra-critical power exercise. The dynamics of fatigue were similar to the primary fatigue-related intramuscular metabolites, suggesting a close mechanistic link between the intramuscular milieu and voluntary muscle power.
Acknowledgements
We thank the volunteers for their time and dedication.
Reference
- Swisher AR, *Koehn B, Yong S, Cunha J, Ferguson C, Cannon DT. Dynamics of locomotor fatigue during supra-critical power exercise. Med Sci Sports Exerc